 |
|
| |
|
|
| Slide |
085 |
Epidemiologic Basis of Tuberculosis Control |
 |
Next |
 |
 |
Previous |
 |
First |
 |
Last |
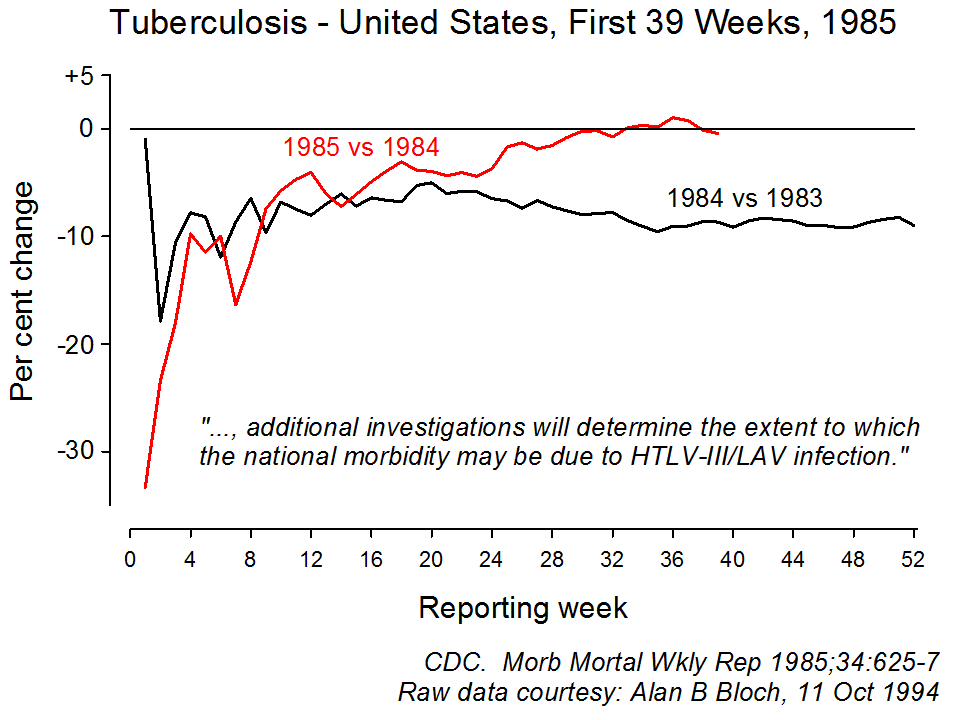
The MMWR reports weekly case counts in a calendar year and cumulative case counts in that year. The CDC epidemiologist compared the weekly the cumulative case counts of the year 1984 with those of the same period of 1983, and the weekly cumulative case counts of the year 1985 with those of the same period of 1984, and expressed the change as a percentage.
In the first weeks of a year the differences between the cumualtive cases in one year compared to that in the previous year of the same period fluctuate strongly because the number is still small and even small absolute difference can make large percentage differences. With the increase in the cumulative number as the year progresses the fluctuations becomes less and the differences consolidate. Somewhere around week 20 there begins a suggestion that the change from 1984 to 1985 is different from that compared to the change from 1983 to 1984. By mid-year it seems to become apparent that in the earlier period a predictable decline in the case count was around ten percent but in the current comparison (1985 versus 1984), there was no decline. By September (week 39), CDC staff was certain that this would hold and alerted the American public in an MMWR article to the failure of tuberculosis to decline in 1985 and the possibility that HIV infection may play a role in this observation.
It was the first ever report in the world on a possible national impact of the HIV epidemic on tuberculosis.
This example shows 1) the key role of a sturdy surveillance system, 2) the tremendous power of a simple case count, 3) the equal power of a simple epidemiologic analysis, and 4) the need for continuous alertness by properly using the existing surveillance system. |
| |
|
Go to top
Last update:
September 10, 2010