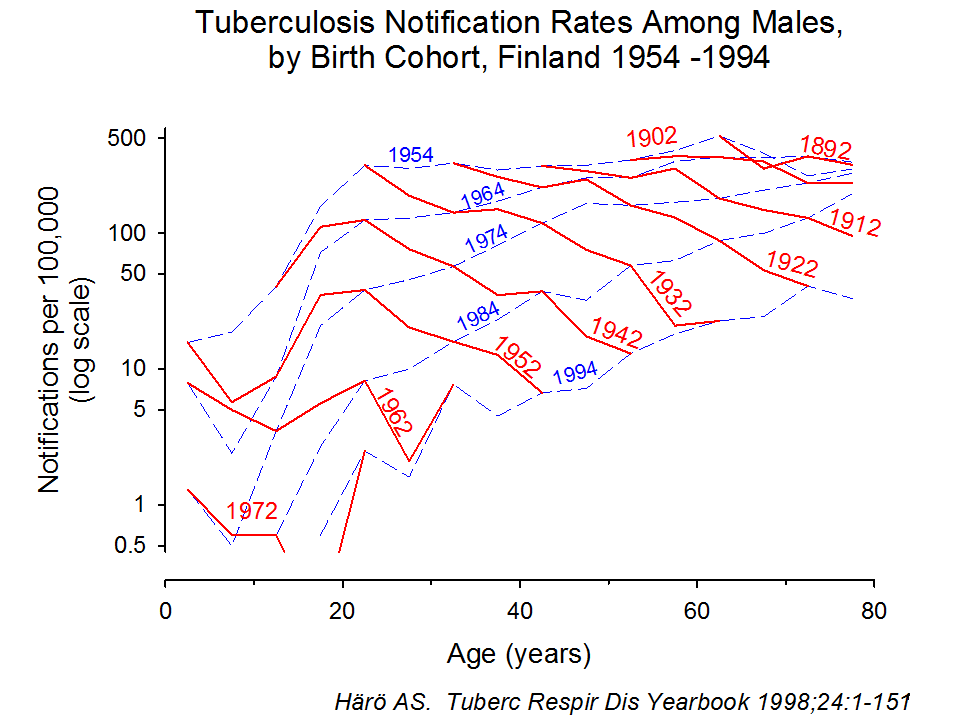
| That cross-sectional data do not tell the entire story is shown here, where the same data from Finland are displayed by birth cohort.
The cross-sectional presentation from the previous slide is retained here as dotted lines, but just for the years 1954 and 1994.
For example, patients aged 70 to 74 years old (on average 72.5 years old) in 1994 were born in 1922. In 1954, they were on average 32.5 years old as can readily be seen at the intersection of the dotted line for 1954 and the full line for the birth cohort. If sufficiently detailed information is available (as is the case in Finland), then a line showing the morbidity experience within each birth cohort at different calendar times can be drawn. The picture that emerges now is quite different.
There are three elements in this display: age, cohort, and period effects.
By age, the highest rates were recorded in young adults, seen here in full for the 1942 and 1952 birth cohorts, and strongly suggestive for the other birth cohorts with less complete information.
For each successive birth cohort, tuberculosis morbidity decreases.
Finally, there is a period effect, indicated by the degree of parallelism of the birth cohort lines: if they are parallel, then there is no period effect. Conversely, deviations from parallelism indicate a period effect (such as in a war when morbidity rates tend to increase).
The reason for this apparent paradox in displaying the same data in two different ways is entirely attributable to the fact that tuberculosis in Finland has been declining so rapidly. What is seen cross-sectionally as high rates in older persons is in fact a mere residual of a much higher morbidity their cohort experienced when it was young. |