 |
|
| |
|
|
| Slide |
129 |
Epidemiologic Basis of Tuberculosis Control |
 |
Next |
 |
 |
Previous |
 |
First |
 |
Last |
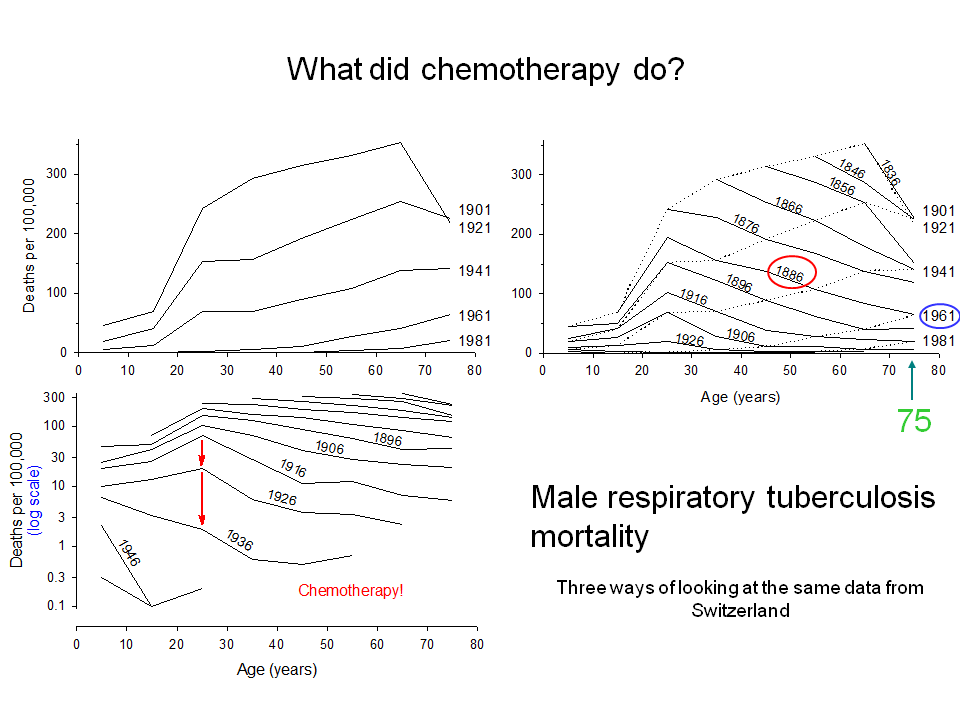
In this slide, three formats of displaying the same data are shown. On the top left, the usual cross-sectional age-specific mortality is shown. On the top right, the data are shown by birth cohort as elaborated earlier, using a linear scale. On the bottom left, only the mortality by birth cohort is shown and it is depicted on a logarithmic scale to better appreciate the relative change within age groups at ten-year intervals.
This last figure visualizes the tremendous impact of cohemotherapy on mortality. The 1916 birth cohort was 25 years old in 1941, the years immediately preceding the introduction of the first antituberculosis drugs. The 1926 birth cohort was 25 years old in 1951, the time when streptomycin and para-aminosalicylic acid had become available, but not yet isoniazid which was introduced in 1952. The larger reduction in mortality then that for the previous cohort is already noticeable, but it becomes really obvious for the next, the 1936 birth cohort which became young adults after the introduction of isoniazid: the peak mortality among young adults has simply been "shaved off". |
| |
|
Go to top
Last update:
September 10, 2010